
ELK-7.16.3集群部署实战
浏览量:258
ELK是一款开源的海量日志搜索分析平台,能够完美的解决我们上述的问题,对日志进行集中采集和实时索引,提供实时搜索、分析、可视化、报警等功能,帮助企业在统一平台实时管理日志数据,进行线上业务实时监控、异常原因定位、数据统计分析。ELK由ElasticSearch、Logstash和Kiabana三个开源工具组成。
Elasticsearch是实时全文搜索和分析引擎,提供搜集、分析、存储数据三大功能;是一套开放REST和JAVA API等结构提供高效搜索功能,可扩展的分布式系统;它构建于Apache Lucene搜索引擎库之上
Logstash是一个用来搜集、分析、过滤日志的工具。它支持几乎任何类型的日志,包括系统日志、错误日志和自定义应用程序日志。它可以从许多来源接收日志,这些来源包括 syslog、消息传递(例如 RabbitMQ)和JMX,它能够以多种方式输出数据,包括电子邮件、websockets和Elasticsearch
Kibana是一个基于Web的图形界面,用于搜索、分析和可视化存储在 Elasticsearch指标中的日志数据。它利用Elasticsearch的REST接口来检索数据,不仅允许用户创建他们自己的数据的定制仪表板视图,还允许他们以特殊的方式查询和过滤数据
一个完整的集中式日志系统,需要包含以下几个主要特点:
1)收集-能够采集多种来源的日志数据;
2)传输-能够稳定的把日志数据传输到中央系统;
3)存储-如何存储日志数据;
4)分析-可以支持 UI 分析;
5)警告-能够提供错误报告,监控机制;
而ELK则提供了一整套解决方案,并且都是开源软件,之间互相配合使用,完美衔接,高效的满足了很多场合的应用。是目前主流的一种日志系统。
官方网站https://www.elastic.co/products
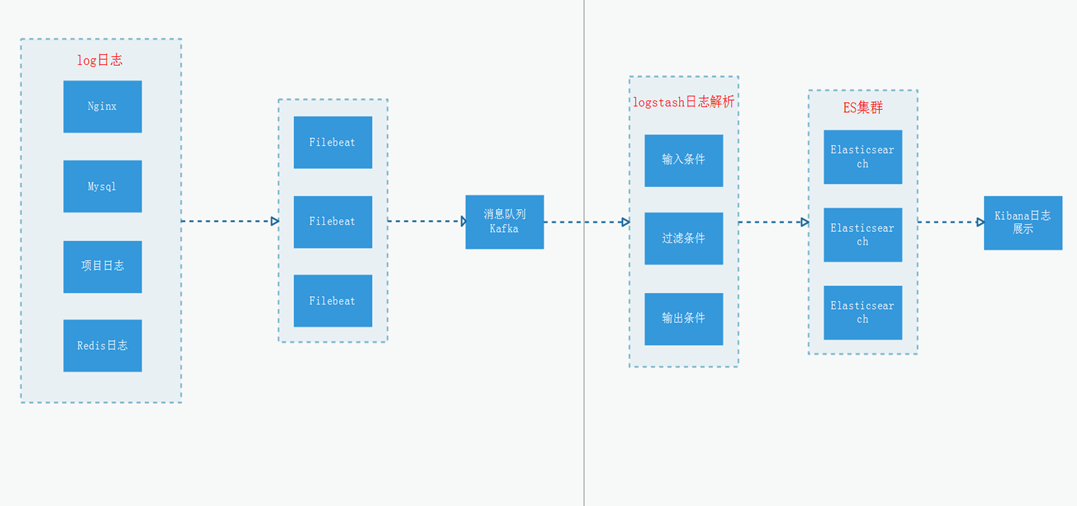
集群部署规划架构图(演示):
ELK下载地址:
wget https://artifacts.elastic.co/downloads/elasticsearch/elasticsearch-7.16.3-linux-x86_64.tar.gz
wget https://artifacts.elastic.co/downloads/kibana/kibana-7.16.3-linux-x86_64.tar.gz
wget https://artifacts.elastic.co/downloads/logstash/logstash-7.16.3-linux-x86_64.tar.gz
基础环境准备
1、关闭防火墙和selinux
systemctl stop firewalld
systemctl disable firewalld
setenforce 0
sed -i '/SELINUX/s/enforcing/disabled/' /etc/selinux/config
2、内核优化
# /etc/security/limits.conf(可选)
末尾添加
* soft nofile 65535
* hard nofile 65535
* soft nproc 65535
* hard nproc 65535

#/etc/sysctl.conf
如下参数
net.ipv4.tcp_max_syn_backlog = 65536
net.core.netdev_max_backlog = 32768
net.core.somaxconn = 32768
net.core.wmem_default = 8388608
net.core.rmem_default = 8388608
net.core.rmem_max = 16777216
net.core.wmem_max = 16777216
net.ipv4.tcp_timestamps = 0
net.ipv4.tcp_synack_retries = 2
net.ipv4.tcp_syn_retries = 2
net.ipv4.tcp_tw_recycle = 1
net.ipv4.tcp_tw_reuse = 1
net.ipv4.tcp_mem = 94500000 915000000 927000000
net.ipv4.tcp_max_orphans = 3276800
net.ipv4.tcp_fin_timeout = 120
net.ipv4.tcp_keepalive_time = 120
net.ipv4.ip_local_port_range = 1024 65535
net.ipv4.tcp_max_tw_buckets = 30000
fs.file-max=655350
vm.max_map_count = 262144
net.core.somaxconn= 65535
net.ipv4.ip_forward = 1
net.ipv6.conf.all.disable_ipv6=1

#生效
sudo sysctl -p
一、Elasticsearch
1、创建数据目录和授权(所有主机执行以下操作)
tar xf elasticsearch-7.16.3-linux-x86_64.tar.gz -C /data/
cd /data/elasticsearch-7.16.3
sudo mkdir /data/elasticsearch-7.16.3/es7.16.3 -p
注意:es需要使用非root用户启动。
2、修改配置
cluster.name: meta-meeting
node.name: node-129
path.data: /data/elasticsearch-7.16.3/es7.16.3
path.logs: /data/elasticsearch-7.16.3/logs
network.host: 10.148.181.129
http.port: 9200
transport.tcp.port: 9300
discovery.seed_hosts: ["10.148.181.129:9300", "10.148.181.130:9300","10.148.181.131:9300"]
cluster.initial_master_nodes: ["10.148.181.129:9300", "10.148.181.130:9300","10.148.181.131:9300"]
xpack.security.enabled: true
xpack.security.transport.ssl.enabled: true
xpack.security.transport.ssl.verification_mode: certificate
xpack.security.transport.ssl.keystore.path: /data/elasticsearch-7.16.3/config/elasticsearch-certificates.p12
xpack.security.transport.ssl.truststore.path: /data/elasticsearch-7.16.3/config/elasticsearch-certificates.p12
xpack.monitoring.collection.enabled: true


cluster.name: meta-meeting
node.name: node-130
path.data: /data/elasticsearch-7.16.3/es7.16.3
path.logs: /data/elasticsearch-7.16.3/logs
network.host: 10.148.181.130
http.port: 9200
transport.tcp.port: 9300
discovery.seed_hosts: ["10.148.181.129:9300", "10.148.181.130:9300","10.148.181.131:9300"]
cluster.initial_master_nodes: ["10.148.181.129:9300", "10.148.181.130:9300","10.148.181.131:9300"]
xpack.security.enabled: true
xpack.security.transport.ssl.enabled: true
xpack.security.transport.ssl.verification_mode: certificate
xpack.security.transport.ssl.keystore.path: /data/elasticsearch-7.16.3/config/elasticsearch-certificates.p12
xpack.security.transport.ssl.truststore.path: /data/elasticsearch-7.16.3/config/elasticsearch-certificates.p12
xpack.monitoring.collection.enabled: true


cluster.name: meta-meeting
node.name: node-131
path.data: /data/elasticsearch-7.16.3/es7.16.3
path.logs: /data/elasticsearch-7.16.3/logs
network.host: 10.148.181.131
http.port: 9200
transport.tcp.port: 9300
discovery.seed_hosts: ["10.148.181.129:9300", "10.148.181.130:9300","10.148.181.131:9300"]
cluster.initial_master_nodes: ["10.148.181.129:9300", "10.148.181.130:9300","10.148.181.131:9300"]
xpack.security.enabled: true
xpack.security.transport.ssl.enabled: true
xpack.security.transport.ssl.verification_mode: certificate
xpack.security.transport.ssl.keystore.path: /data/elasticsearch-7.16.3/config/elasticsearch-certificates.p12
xpack.security.transport.ssl.truststore.path: /data/elasticsearch-7.16.3/config/elasticsearch-certificates.p12
xpack.monitoring.collection.enabled: true
3、生成证书并拷贝到其他节点
bin/elasticsearch-certutil cert -out /data/elasticsearch-7.16.3/config/elasticsearch-certificates.p12 -pass ""

scp -r config/elasticsearch-certificates.p12 10.148.181.130:/data/elasticsearch-7.16.3/config/
scp -r config/elasticsearch-certificates.p12 10.148.181.131:/data/elasticsearch-7.16.3/config/
4、依次启动elasticsearch
bin/elasticsearch -d
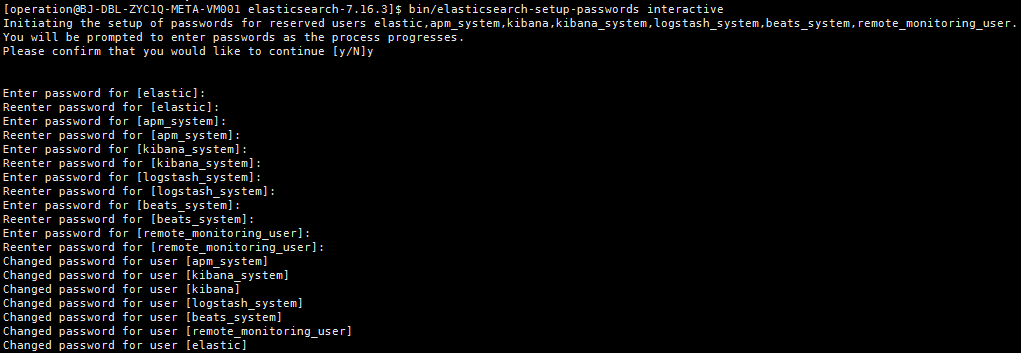
5、生成集群密码
bin/elasticsearch-setup-passwords interactive
手动设置密码,elastic,apm_system,kibana,logstash_system,beats_system,remote_monitoring_user,这些用户登录时会用到。
浏览器登录http://ip:9200显示如下:

二、logstash
本文我们以filebeat输入nginx日志到kafka为例,首先我们要部署filebeat,简述安装过程如下
wget https://artifacts.elastic.co/downloads/beats/filebeat/filebeat-6.5.0-linux-x86_64.tar.gz
tar  xf filebeat-6.5.0-linux-x86_64.tar.gz -C /data/
cd /data/filebeat-6.5.0
修改文件filebeat.yml

filebeat.config.modules:
  path: ${path.config}/modules.d/*.yml
  reload.enabled: false
setup.template.settings:
  index.number_of_shards: 3
output.kafka:
  hosts: ["kafka1:9092","kafka2:9092","kafka3:9092"]   #注意需要填写IP地址
  topic: "nginx" #请根据项目topic填写
  codec.json:
    pretty: false

启动nginx module

$ ./filebeat modules enable nginx

修改文件modules.d/nginx.yml
- module: nginx
  # Access logs
  access:
    enabled: true

    # Set custom paths for the log files. If left empty,
    # Filebeat will choose the paths depending on your OS.
    var.paths: ["path/logs/access.log"]

  # Error logs
  error:
    enabled: true

    # Set custom paths for the log files. If left empty,
    # Filebeat will choose the paths depending on your OS.
    var.paths: ["path/logs/error.log"]

启动filebeat
nohup ./filebeat -e -c filebeat.yml > filebeat.log &
1、部署logstash(任意一台主机部署即可)
tar xf logstash-7.16.3-linux-x86_64.tar.gz -C /data/
cd logstash-7.16.3/config
2、meta-nginx.conf 模板
input {
 kafka {
    bootstrap_servers => "kafka1:9092,kafka2:9092,kafka3:9092"
    topics => ["nginx"]
    codec => "json"
    group_id => "meta-nginx"
    auto_offset_reset=>"latest"
	consumer_threads => 2
    decorate_events => true
  }
}

output {
    elasticsearch {
             hosts => [ "http://es1:9200","http://es2:9200","http://es3:9200" ]
             index=> "meta-nginx-%{+YYYY.MM.dd}"
             template_name=>"meta-nginx-template"
             manage_template=>false
             user => "elastic"
             password => "password"
    }
}
3、启动logstash
nohup ../bin/logstash -f meta-nginx.conf -l ../logs/meta-nginx/ --config.reload.automatic >/dev/null &
注意如果要启动多个需要删除 .lock文件
三、kibana
1、解压kibana
tar xf kibana-7.16.3-linux-x86_64.tar.gz -C /data/
cd /data/kibana-7.16.3-linux-x86_64/
2、修改config/kibana.yml
server.port: 5601
server.host: "本机IP"
server.basePath: "/meta"
server.rewriteBasePath: true
elasticsearch.hosts: ["http://es1:9200","http://es2:9200",http://es3:9200]
elasticsearch.username: "kibana_system"
elasticsearch.password: "password"
3、启动kibana
nohup bin/kibana &
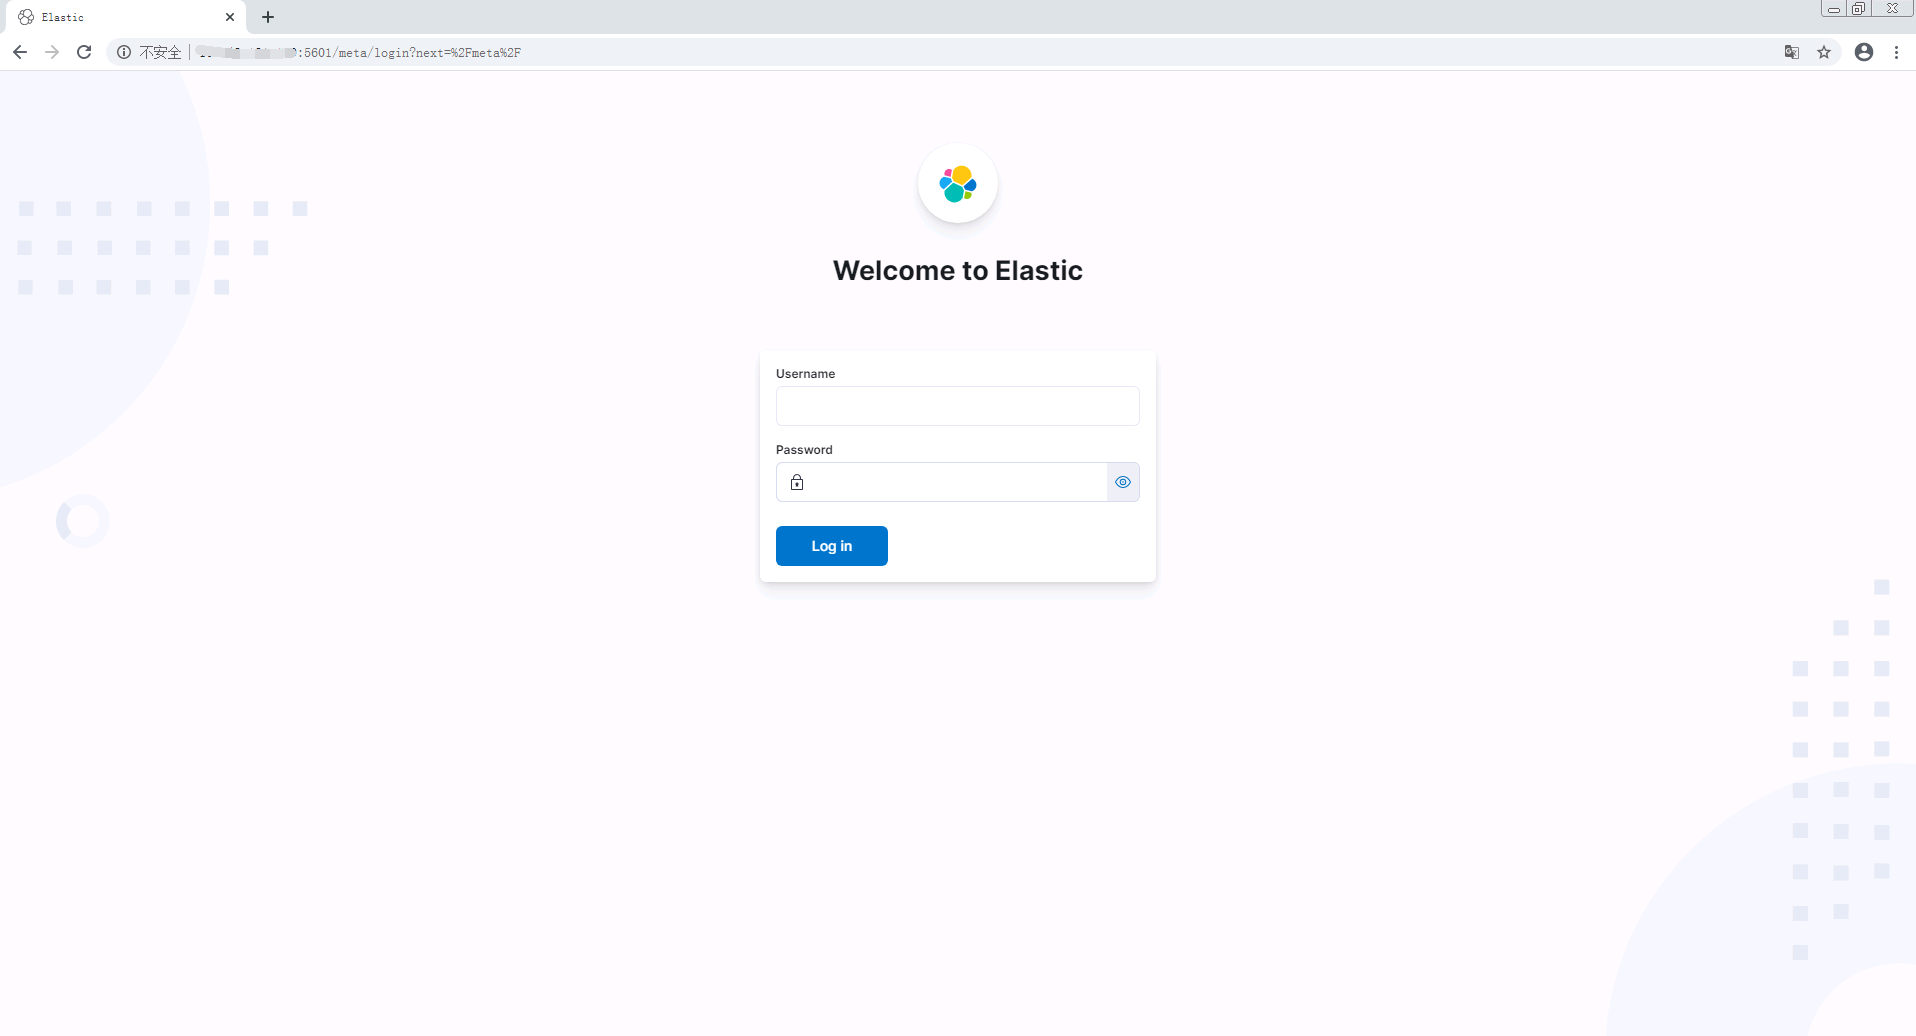
4、浏览器访问http://ip:5601/meta
神回复
发表评论:
◎欢迎参与讨论,请在这里发表您的看法、交流您的观点。